Showing posts with label Programming. Show all posts

Tuesday, November 7, 2017

Installing TensorFlow 1.4 on Windows 10 with Anaconda

I had a few problems during my install, so this will serve to document the procedure I used to get it to work correctly. The general install instructions are on tensorflow.org. These instructions may work on other versions of Windows, but they have not been tested. In this case I am installing the GPU enabled version, and I am assuming you have already verified that your graphics card is supported.

1) Install CUDA Toolkit 8.0

Do not install CUDA 9.0 unless you know what you are doing. 9.0 will be supported in TensorFlow 1.5 according to THIS post. For now you will have to download 8.0 from the CUDA archive. It kept bugging me to install Visual Studio, and I finally did. I don't think that is actually a requirement though if you plan to use something else.

2) Install cuDNN 6.0

I could not find an install for version 6.1, but this seemed to work just fine. You can find the different versions HERE. Just unzip them somewhere convenient and add the cuda/bin directory to the system %PATH% environment variable.

3) Create/Activate Anaconda Environment

If you have not already installed Anaconda, install it with Python version 3.6 (the instructions say 3.5, but I used an environment I already had set up with 3.6). Create the conda environment by opening the Anaconda prompt and typing:


conda create --name myEnvName python=3.6

Activate the environment by then typing:

activate myEnvName

4) Install TensorFlow Using pip

This step is where you need to pay attention. Do not follow the instructions on the TensorFlow website. When I did what they say I got the error described in THIS post. My conda environment would no longer activate. There was probably an easy fix, but I ended up having to reinstall Anaconda. If you find another solution, let me know in the comments. Instead, use this command (in your virtual environment):

pip install tensorflow-gpu 

While it looks like there is a conda-forge package you could install. The latest version of it at the time of this writing is 1.3.0. Granted TensorFlow 1.4 is only 5 days old, so they may release version 1.4 tomorrow on conda. If so, that would be an attractive option.

5) Validate your Install

You can now validate your install using the short program specified on the TensorFlow website.


python 

import tensorflow as tf
hello = tf.constant('Hello, TensorFlow!')
sess = tf.Session()
print(sess.run(hello))


This is how I got my install to work. If you have any errors, feel free to post them below, but you're better off Googling them or posting on StackOverflow.

Matthew

Saturday, November 4, 2017

Querying SQLite database using sqlite3 in JavaScript

Motivation

I've never regretted studying mechanical engineering instead of electrical engineering or computer science, but sometimes by lack of formal programming knowledge does bite me. This happened a few days ago when I wanted to see if I could apply some machine learning techniques to some data in a SQLite database. Having no experience with SQL and minimal experience with javascript, I Googled how to get the data. The answers that I found seemed overly complicated. As such, this post will be a practical example of  querying the data from an SQLite database. It is as much for my memory as anything. I was using JavaScript (via Node) and sqlite3. I did this on a Virtual Machine running Ubuntu, but I believe all of the tools I use can be used in Windows as well.

Data Visualization using SQLiteStudio

Here is a visualization of the data. It is some historical trade data from the cryptocurrency exchange,  Poloniex. Having never used SQL before, I downloaded SQLiteStudio to see what the data actually looked like. As you can see, the database contains two tables - in this case one for each of the two trading pairs for which I had data. Inside those tables, there are labeled columns. Each row has a unique id. 


Querying the Database using sqlite3

I found a tutorial (THIS ONE) and tried to follow it, but I found that it took a frustratingly long amount of time to figure out what all of the values meant. Anyway, here is my javascript code to query a single line from the database. If you understand this, the above tutorial should be easy to adapt to pulling multiple lines. Of course, you need to already have sqlite3 installed. 


//Import sqlite to read database
const sqlite3 = require('sqlite3').verbose();
//Connect to database
let db = new sqlite3.Database('./history/poloniex_0.1.db', (err) => {
  if (err) {
    console.error(err.message);
  }
  console.log('Connected to the database.');
});


// get columns start and label it as startval, open-> openval, etc from the appropriate table
// when the id = what we define it as below
let sql = `SELECT start startval,
                  open openval,
                  high highval
           FROM candles_USDT_ETH
           WHERE id = ?`;

let id = 2;
 
// Get only [id] row (in this case 2nd row)
db.get(sql, [id], (err, row) => {
  if (err) {
    return console.error(err.message);
  }
  return row
    ? console.log(row.startval, row.openval, row.highval)
    : console.log(`No values found with the id ${id}`);
 
});


// Close the database
db.close((err) => {
  if (err) {
    console.error(err.message);
  }
  console.log('Close the database connection.');
});


Converting the Table to CSV

Another useful thing I stumbled upon was how to convert a database from SQL to CSV in order to import it into some other program (in my case MATLAB). For my MATLAB example, I did not have the database toolbox, so this allowed me to play with this data without it. I copied THIS tutorial. It is more thorough, but here is the highlight. To save the start, open, and high columns from the candles_USDT_ETH table, use the following code.


sqlite3 ./history/poloniex_0.1.db
.headers on
.mode csv
.output data.csv
SELECT start,
       open, 
       high
FROM candles_USDT_ETH;
.quit


That's all I have for now. As I mentioned above, like many of my posts this is as much for my memory as anything, but I hope it helps someone.
-Matthew


Wednesday, September 27, 2017

Tracking AR Tags with ROS: Monocular Vision

If you've found this I am going to assume that you are familiar with ROS. What you might not be so familiar with is AR tags (Augmented Reality Tags). I am not going to go into how AR tags work, because frankly I am not an expert in them. What I can say is that I have used them, and it is very easy using ROS. They allow anyone with a cheap webcam to get a full 6 DOF position from a single reference, an AR tag. They can be printed on any home printer and are fully scalable. Below is a picture of what a simple implementation looks like. Search YouTube for some videos. People are doing some cool things with them, but enough talk. Lets get a demo working.

Tracking 3 AR tags with a Standard Monocular Webcam, a Logitech C615


This post is the documentation for how I got it working on my machine. It should be mostly complete, but I will admit that I have probably left out some things that I thought were self explanatory. If you have problems or suggest changes, please post those in the comments.

AR tag

Prerequisites

1) Installed ROS Kinetic. I am using a virtual machine as detailed HERE.
2) Setup Catkin Workspace (I'll assume it's called catkin_ws).
3) Know some basic ROS. If you don't you can likely Google your questions.

Setup

Install package ar_track_alvar

1) Open a terminal in catkin_ws/src
2) In the terminal type:

git clone -b kinetic-devel https://github.com/ros-perception/ar_track_alvar.git 
cd ..
catkin_make


Install package video_stream_opencv

1) Open a terminal
2) In the terminal type:

sudo apt-get install ros-kinetic-video-stream-opencv
sudo apt-get update


Create our custom package

1) Open a terminal in catkin_ws/src
2) In the terminal type:

catkin_create_pkg ar_tag_demo std_msgs rospy


Install package image_pipeline

This is likely already installed. You can check with <rospack list>. If it is not simply enter into a terminal:

sudo apt-get install ros-kinetic-image-pipeline

Then run another catkin_make.

Write Launch Files

Camera.launch

In your custom package "ar_tag_demo", create a new folder called "launch". Inside, create a file called camera.launch. Copy the code below into it. It is a modified version of the camera.launch file from video_stream_opencv. Note that video_stream_provider may have to be changed to 1 if you are using an external camera. If you are using a virtual machine like I am, you will need to enable the webcam under Devices>Webcam in the Virtual Box menu. If you have issues with this, install the Virtual Box extension pack as discussed in my previous post.

<launch>
   <arg name="camera_name" default="camera" />
   <!-- video_stream_provider can be a number as a video device or a url of a video stream -->
   <arg name="video_stream_provider" default="0" />
   <!-- frames per second to query the camera for -->
   <arg name="fps" default="10" />
   <!-- frame_id for the camera -->
   <arg name="frame_id" default="camera_link" />
   <!-- By default, calibrations are stored to file://${ROS_HOME}/camera_info/${NAME}.yaml
   To use your own fill this arg with the corresponding url, e.g.:
   "file:///$(find your_camera_package)/config/your_camera.yaml" -->
    <arg name="camera_info_url" default="" />
   <!-- flip the image horizontally (mirror it) -->
   <arg name="flip_horizontal" default="false" />
   <!-- flip the image vertically -->
   <arg name="flip_vertical" default="false" />
    <!-- force width and height, 0 means no forcing -->
    <arg name="width" default="0"/>
    <arg name="height" default="0"/>
   <!-- if show a image_view window subscribed to the generated stream -->
 <arg name="visualize" default="true"/>

   
    <!-- images will be published at /camera_name/image with the image transports plugins (e.g.: compressed) installed -->
    <group ns="$(arg camera_name)">
     <node pkg="video_stream_opencv" type="video_stream" name="$(arg camera_name)_stream" output="screen"> 
      <remap from="camera" to="image_raw" />
      <param name="camera_name" type="string" value="$(arg camera_name)" />
         <param name="video_stream_provider" type="string" value="$(arg video_stream_provider)" />
         <param name="fps" type="int" value="$(arg fps)" />
         <param name="frame_id" type="string" value="$(arg frame_id)" />
         <param name="camera_info_url" type="string" value="$(arg camera_info_url)" />
         <param name="flip_horizontal" type="bool" value="$(arg flip_horizontal)" />
         <param name="flip_vertical" type="bool" value="$(arg flip_vertical)" />
         <param name="width" type="int" value="$(arg width)" />
         <param name="height" type="int" value="$(arg height)" />
     </node>

     <node if="$(arg visualize)" name="$(arg camera_name)_image_view" pkg="image_view" type="image_view">
      <remap from="image" to="image_raw" />
     </node>
 </group>

</launch>


Track.launch

Next we create the launch file that does the tracking. Again, this is a modified launch file from the ar_track_alvar package. Create a file called track.launch in your launch file folder and copy the following code inside it. Note that you will need to set the marker size. This is the length in centimeters of one side of the black part of an AR Tag.


<launch>
 <arg name="marker_size" default="6.9" />
 <arg name="max_new_marker_error" default="0.08" />
 <arg name="max_track_error" default="0.2" />
 <arg name="cam_image_topic" default="/camera/image_raw" />
 <arg name="cam_info_topic" default="/camera/camera_info" />
 <arg name="output_frame" default="/camera_link" />
 

 <node name="ar_track_alvar" pkg="ar_track_alvar" type="individualMarkersNoKinect" respawn="false" output="screen">
  <param name="marker_size"           type="double" value="$(arg marker_size)" />
  <param name="max_new_marker_error"  type="double" value="$(arg max_new_marker_error)" />
  <param name="max_track_error"       type="double" value="$(arg max_track_error)" />
  <param name="output_frame"          type="string" value="$(arg output_frame)" />

  <remap from="camera_image"  to="$(arg cam_image_topic)" />
  <remap from="camera_info"   to="$(arg cam_info_topic)" />
 </node>
</launch>


main.launch

Because this is a demo, you might only want to have to launch one file. This launch file simply calls the other two.

<launch>
 <include file="$(find ar_tag_demo)/launch/camera.launch" />
 <include file="$(find ar_tag_demo)/launch/track.launch" />

</launch>


Running the files

Camera Calibration

You will want to calibrate the camera using the camera_calibrate node (part of the image_pipeline package). You can follow the instructions found on the wiki for monocular camera calibration: http://wiki.ros.org/camera_calibration/Tutorials/MonocularCalibration

Here are the pertinent parts: 

1) Print the checkerboard pdf.
2) Open a terminal and type:

rosdep install camera_calibration
rosrun ar_tag_demo camera.launch
rosrun camera_calibration cameracalibrator.py --size 8x6 --square 0.0245 image:=/camera/image_raw camera:=/camera

Note that that the grid size (8x6) and square size (.0245) is for the above as printed on my printer. You may have to adjust it. The square size is in meters.

3) Complete the calibration by moving the checkerboard around the camera's field of view and rotating it in all directions.
4) When you are done, click commit to automatically save the camera calibration data. The camera node will now automatically pull that calibration file when you launch it.
5) ctrl + c in all terminal windows to stop camera and calibration nodes

Run the demo

In a terminal type the following command. 

roslaunch ar_tag_demo main.launch

This should bring up the camera and the tracking node. Feel free to rostopic echo ar_pose_marker to see the raw data, but RVIZ is probably more impressive. Launch RVIZ (type rviz into a terminal), and add TF to the data visualized on the left. Show the camera a marker, then set fixed frame to "camera_frame". You should now see something like this!


Show off your AR tag demo with pride! Don't tell anyone that Scott Neikum (the code maintainer) did all the hard work for you.

I hope this was helpful to someone. If it was, comment below and let me know. If you run into any problems or see anything that should be changed, comment below for that as well. 

Until next time,
Matthew

Thursday, September 21, 2017

Installing ROS on a Virtual Machine for Windows

This is a quick set of instructions for installing ROS Kinetic on a Virtual Machine. This allows you to run ROS on Windows.

1) Install Virtual Box from this link.
2) Install the Virtual Box Extension Pack for your version of Virtual Box (also at this link). This allows you to use the USB ports on your computer within the virtual machine.
3) Download the Ubuntu 16.04 LTS .iso from this link.
4) Run Virtual Box and create a virtual machine with the .iso you downloaded.
5) In the virtual machine go to Devices > Insert Guest Additions CD image and install guest additions. This adds additional functionality, most notably the shared clipboard. Enable this under Devices > Shared Clipboad > Bidirectional.
6) Follow the instructions on the ROS Wiki to install ROS Kinetic (link).
7) Follow the instructions on the ROS Wiki to setup your Catkin workspace (link).
8) Make a snapshot of your new clean ROS install by going to Machine > Take Snapshot. This allows you to roll back to a fresh install if you tank it at some point.
9) Proceed to other projects! Here are some of mine to get you started (link)

Matthew

Tuesday, March 10, 2015

Fixing Autoscroll in GNU Octave for Windows

Introduction
A quick and dirty post documenting an Octave "fix" for a problem I was having. Running GNU Octave version 3.8.2-5 from MXE installer found HERE on a Windows 7 64 bit PC on 3/10/2015.

The Problem

The output of GNU Octave as installed above has a feature that while I am sure is useful to some, is quite irritating to me. Outputs that are too long to fit on the screen of the terminal are paginated. It will display the values that will fit on the screen and then wait for you to press "f" to see the next page worth's of data. See below. It displays "-- less -- (f)oward, (b)ack, (q)uit" at the end of each page.

While this may be great if you want to see every single value, if you are running long programs where the output is mostly for debugging purposes or similar, this can be irritating. I finally decided to figure out how to change this. Here it is.


A Solution

While I don't claim to understand exactly what is going on above, it is clear that the "pager" being used on my install is "less". I wanted to change it to "more".

1) Check what pager you are using - Type "PAGER()". My guess is it will probably be "less". 

2) View help file on PAGER() - Type "help PAGER". A couple useful websites: Documentation from a German university and Documentation on the Octave Wiki.

3) Change pager to "more" - Type "PAGER("more")

This should make the output look like the picture below. As you can see it scrolled through my entire output just fine. I will note that "PAGER()" now returns "more". Honestly, I don't really know what I changed under the hood, but it worked. Also note that it will reset when you reopen Octave.


That is all I have on this. If anyone has a more detailed explanation of how this works or other ways to fix this "problem" feel free to post in the comments.
-Matthew

Thursday, March 5, 2015

Serial Port Communication with GNU Octave in Windows

This is not so much a finished post as it is a place to record progress. Use any information found on this page at your own risk.

Introduction

I have been using GNU Octave in place of MATLAB on my laptop for a while now. It is free and serves my purposes well. One place MATLAB does have it beat though is in its ability to communicate with outside hardware through a serial port. I recently needed this functionality for Octave. This is how I made it work. My configuration:
  • Windows 7 - 64 bit
  • GNU Octave 3.8.2-5 using MXE installer
  • Instrument Control Package 0.2.1

Walkthrough

Install Octave

If you found this post I will assume you are probably running Windows. There is a convenient unoffical installer for Windows HERE. At the time of this writing I am running 3.8.2-5. Anything greater than 3.8.0 has the nice MATLAB style GUI.

Install Instrument Control Package

The equivalent of MATLAB toolboxes are packages in Octave. You need the instrument-control package to access the serial ports. There are two ways to install it.

1) Install it from Octave forge. Assuming you have an internet connection, open Octave and type in the command window "pkg install -forge instrument-control-0.2.1.tar.gz" Replace the 0.2.1 with the newest version of the package.

2) Download it from HERE. Assuming you did a standard install, move it to the folder "C:/Octave/Octave-3.8.2/src". There you will find all the other packages that were included with the installer. Now open Octave and make that folder your directory. Type in the command window "pkg install instrument-control-0.2.1.tar.gz". Obviously you may need to change the name of the package if you download a newer version.

Both options will take a while. One of my first mistakes was thinking I had crashed my computer. I wasn't sure if it would work on Windows, so when it just sat there for a minute I thought it was hung. Just give it some time. Mine took a couple minutes. 

Load Instrument Control Package

You only have to install the package once, but you need to load it every time you open Octave (you can also set it to auto load. Google it.)

Type "pkg list" to see all your installed packages. If you don't see instrument-control then you need to go back to the last step. Any package with an * by it is loaded.

To load the package type "pkg load instrument-control". Now load the list of packages again to see if it worked.

Use the Package

Now the part you have been waiting for. It is important to note that at the time of this writing the instrument control package is not a drop in replacement for the serial capabilities of MATLAB. Here are some helpful links to illustrate this. It is fairly obvious that the function names are different or missing for Octave.
For my initial test I used an Arduino with a jumper between Rx and Tx. This essentially mirrored anything I sent back to me. To simplify things, go to the device manager and change the serial port number to COM1 through COM8. Over that and additional work is needed. Device Manager > your port > Port Settings > Advanced > COM Port Number.

My Additions
To better serve my needs I added a few files to make the package more MATLAB compatible. Just make sure they are in your path somewhere if you want to use them.

srl_fwrite: Download HERE. Similar to the MATLAB fwrite. The regular srl_write only accepts char and uint8s. I made this function to simplify sending other variable types. Accepts three inputs 
  • Serial Object
  • Data to be sent
  • Data Type - int8, uint8, int16, uint16, int32, uint32, int64, or uint64
srl_fread: Download HERE. Similar to MATLAB fread. Reads serial port and returns data type specified. Takes three inputs.
  • Serial Object
  • Number of values to be returned. (eg for 3 uint64s, enter 3 not 24)
  • Data Type - int8, uint8, int16, uint16, int32, uint32, int64, or uint64

Test Script
Test Script: This script was taken and modified from the wiki linked above. It opens a serial port, sends a couple values and then attempts to read them when the serial device mirrors them back. A "correct" output should look something like this.

Serial: Supported
s1 = 0x444
int8 = 200
intdata =

    0  142    1   44


That is all I have at the moment. I hope this tutorial was useful to someone out there. I plan to do another post on the way I am actually using this capability in the future as a more in depth example. 

-Matthew

Sunday, February 22, 2015

Replikeo Prusa i3 Rework Build - Part 3: Wiring and Software Setup

Part 3 will cover my wiring of the Replikeo Prusa i3 Rework (mostly following the wiki page). Then I will cover my setup of the Repetier Firmware. I'll save first prints for Part 4. If you are interested in the unboxing and assembly see Part 1 and Part 2 respectively.

Wiring

"Completed" Wiring

As the wiki page already has a very complete set of instructions on wiring, I will refrain from giving a step-by-step description of the procedure. I will instead clarify a few points that caused me a bit of confusion or could cause confusion.

1) The Arduino does indeed mount in the holes shown on the wiki page. The USB port points down. I initially could not manage to get the holes lined up, but they eventually cooperated.

2) The endstops as wired in the picture are connected to the min endstop pin. That doesn't really matter right now, but you will need to know that when you go to setup the firmware.

3) On the power supply L=Line, N=Neutral, and G= Ground. I used a multimeter to find out which wire goes to which pin. If you live in Tennessee you should have about 120 VAC across the line and neutral. Be sure you change the switch on the power supply to 110V mode.

4) When wiring the motors you can plug both Z motors into the ramps board. There are (quite conveniently) two headers there. You don't have to have an external combining pcb as shown in the picture on the wiki.

5) I used the fan that came with the Replikeo kit as an extruder cooling fan, not a "Print Fan". As such, I did not connect it to D9. This required that I crimp on an old servo connector I had to attach it to the extruder fan pins. These are just a 12V breakout. Whenever you plug your printer in, it is going to come on.

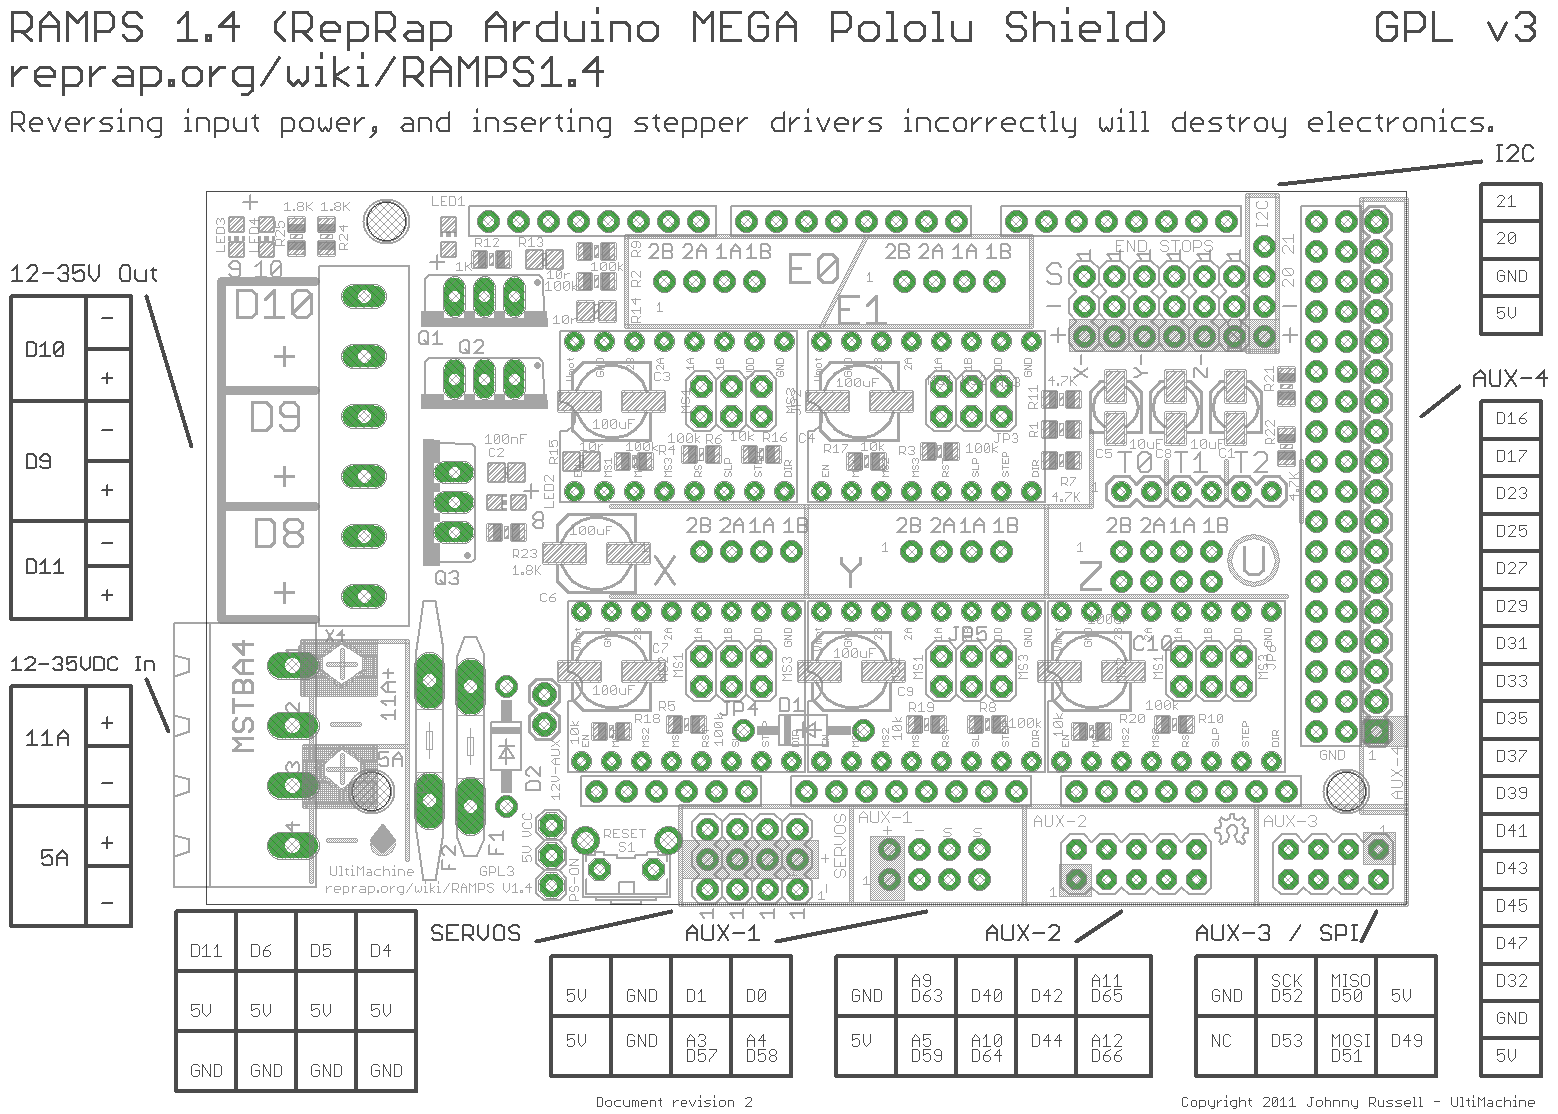
Ramps 1.4 Pinout

 Software

I am using the Repetier Firmware with Repetier Host and Slic3r. Repetier has a very convenient web setup tool. It really wasn't all that difficult and was pretty helpful in figuring out how things worked, but if you are having problems and want to try the firmware I am using download mine HERE. Just upload the configuration.h file and see what's going on. One thing to remember, some of the settings may be getting set in EEPROM. This means you will need to update them from Repetier Host. It's under the Config tab. 

In Repetier Host, be sure to input all the correct Printer Settings. For instance I have a max x endstop and the other two are mins. And my bed is actually 190x170. If you follow the installation instructions on Repetier's website you should be fine.

In Slic3r for the ABS that was included with the kit a lot of the default settings work fairly well. For the filament settings my diameter measured to be about 1.73mm and I print at 230 for the first layer and 215 for the rest. Bed is at 100. I also had some success starting the bed at 100 then dropping it to 85. I have not been able to calibrate the thermistor yet, so I can't be verify that those are the actual temperatures. But those settings work for me.

Now the fun part begins, You get to go play and test things. I doubt very many people will read this and use it as a guide to assembling their printers. However, if you are trying to decide if this is the printer for you, I can confirm that the wiring and software is equally simple. A few hours and I had it working.

That's all for part 3. In part 4 I will show some pictures of my "completed" printer and the modifications I made. Some of them are good. Some of them still require work.

-Matthew

Saturday, December 27, 2014

Linearizing the Sharp IR Ranger (2YOA21) with an Arduino

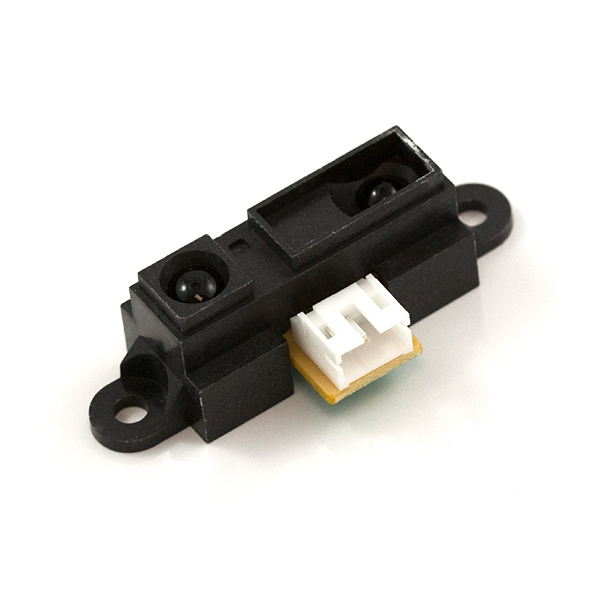
Today I will be linearizing a Sharp IR Ranger. More specifically, I will be using the Sharp 2YOA21 F 04.


First, a quick word on why we would want to do this. The Sharp ir rangers are a very effective means of measuring distance. While ultrasonic sensors (for more about those see the Sensors label) can be fooled by textures and echos, ir sensors are more susceptible to interference from outside light sources and changes in material reflectivity. Therefore,  if a cheap measurement system is required in a varying environment (eg, a mobile robot) a combination of ultrasonic rangers and ir rangers can be quite effective.

If you have found this page, you probably already know this, but I will state it anyway. Sharp ir sensors have an analog output. However, the analog value does not have a linear relationship to distance. In this exercise we will find the function that does relate the two and use that to take an analog value and convert it to a distance.

Wiring

As stated above, the sensor has an analog output. Connect the red lead to +5V, black lead to GND, and yellow lead to A0.

Aquire Data


I used a simple sketch that took the average of 5 values and printed it to the screen. I then manually copied it into an excel spreadsheet along with the measured distance value. 


Fit Data

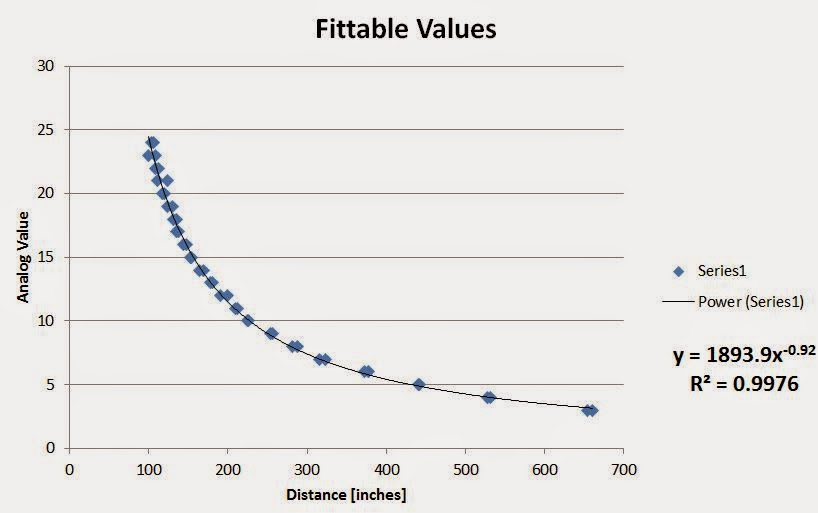
Once you have acquired the data, plot it. Some points will most likely fall outside of the trend. Exclude those points and fit the rest. My fit was Value = 1893.9*Distance^-0.92. 


Use Equation

Solving the equation I got above for Distance gets me this, Distance = (1893.9*Value) ^-1.087.

This is something we can plug into Arduino code. At this point it is only right to note that the method I am using will involve floating point math. There are methods that avoid that. If processing power is at a premium, you might want to check those out.

The important piece of code looks like this:


  float Distance = pow((sensorValue / 1893.9), -1.087); 

If you want the whole thing, you can download my code HERE.

That's all I have. I hope it was useful.

-Matthew


Saturday, November 16, 2013

iRobot Create: Arduino Control

Introduction

This is the fourth section of the iRobot Create tutorial. If you have not completed the first sections, I would recommend that you go back and do so by following the links below.

Sections

Reference Documents

These documents should be referenced for details on interfacing with the Create
  • iRobot Create Open Interface Manual (OIM)- This manual provides detailed information on the serial interface with the Create. It details the implementation of the opcode system used to control the various systems as well as the necessary measures that must be taken to receive sensor data from the Create. Information regarding sensor packet size, connector pinouts, and command details can be found here.
  • Roomba Class Reference Guide (CRG)- This document provides support for the Arduino "Roomba" library. Here details can be found regarding the functions included in that library.
  • iRobot Create User Manual - This manual provides an introduction to the basic functions of the Create and an overview of the basic onboard functionality

Necessary Hardware

Necessary Software


Arduino Control

Arduino control can be implemented using the Roomba library. This library handles all the background serial commands allowing the user to program the Create's functions using the Arduino IDE. If the Roomba library is not installed download it HERE. Unzip and install the library then restart the Arduino IDE (See How to Install a Library).

Arduino Basics

This tutorial assumes basic knowledge of the Arduino IDE. If instructions are unclear or problems arise concerning the Arduino system, refer to THIS page and my previous posts (the ones labeled Arduino).


Wiring

Connecting the Arduino Mega to the Create is simple. In general, connections should be made according to the chart below. See my post, iRobot Create - Arduino interface cable.
Note that Serial1(TX1/RX1) should be used on the Arduino Mega. The serial port output TXD from the Roomba/Create is too weak to drive the RX serial port (Serial0) input of an Arduino properly. This is because of the USB-Serial converter on the Arduino: it also tries to drive the RX serial port input via a pullup resistor, but the Roomba does not have enough drive to pull the RX down below about 2.5 volts, which is insufficient to be reliably detected as a TTL serial input of 0. Furthermore, using Serial1 still allows for the use of the Arduino Serial Monitor for debugging purposes. Also note that Serial2 or Serial3 could be used if selected in software.
Arduino Mega PinCreate Cargo Bay Pin
TX1 (pin 18)RXD (pin 1)
RX1 (pin 19)TXD (pin 2)
GNDGND (pin 14)
Cargo Bay Pinout.JPG
ArduinoMega pinout.png

In this tutorial, connections will be simplified using a custom interface shield and ribbon cable. Connect the Arduino as shown below. See THIS post for details on the custom interface shield and cable.
IRobot Create Arduino Wiring 1.jpgIRobot Create Arduino Wiring 2.JPG
Note:
  • The direction of the ribbon cable is important. It must be connected as shown.
  • The connection of the TX/RX cable is important. Connect it exactly as shown.
    • White: TX1 pin 18
    • Black: RX1 pin 19
  • When using the cargo bay connector, ensure that the mini-DIN connector (the one used with the Create serial cable) is unplugged.

The recommended input voltage for an Arduino is 7-12V, center positive. Verify battery voltage before connecting. 


Checking Connections: TestSuite

This example is included in the Roomba library (see "Necessary Software"). It allows for a quick assessment of Arduino-Create communication.
1) Open TestSuite.pde - In the Arduino IDE: File > Examples > Roomba > TestSuite
2) Connect the USB cable to the Arduino. Install the driver if not already done (How to Install Arduino Drivers)
3) Upload Program
  • Tools > Board > Arduino Mega 2560
  • Tools > Serial Port > [COM port]
  • File > Upload 
4) Open Serial Monitor - Set baud to 9600
5) Restart Arduino Mega by pressing restart button

A message indicating 0 errors should be displayed in the Serial Monitor and the Create should play an audible melody. If errors are reported, check the items listed below. Proceeding to other examples will be futile until these errors are eliminated.
  • TX/RX cable: White -> pin 18 , Black -> pin 19
  • Orientation of ribbon cable
  • Serial monitor baud rate
  • Arduino Driver Installed
  • Correct COM port selected

Controlling Drive Output

This example shows the basics of controlling the Create's movements. There are 2 basic functions that can be used to control the Create's drive motors. The Roomba library provides support for both. Details regarding usage of the 2 functions can be found in the Roomba Class Reference Guide. Information on maximums, minimums, and special cases can be found in the Open Interface Manual. 
  • drive(int16_t velocity, int16_t radius) - Velocity is in mm/s. Radius is in mm. Special values can be found in the CRG.
  • driveDirect(int16_t leftVelocity, int16_t rightVelocity) - Velocity is in mm/s.

1) Turn Create to OFF.
2) Open Roomba_Drive_Test.ino - In the Arduino IDE: File > Examples > Roomba > TTU Examples > Roomba_Drive_Test.ino or copy sketch from link at the bottom of the section.
3) Upload it to the Arduino Mega.
WARNING: If the Create is on, the sketch will start as soon as the upload is complete. Before uploading, turn the Create off. It is important to note that the Create may be ON even if the power LED is off. The power LED turns off when the Create is put in safe or full mode as well. Cycling power until the power LED is lit and then goes off will ensure that the Create is truly OFF. Regardless, it is a good practice to ensure that adequate space is available in case of accidental movement.
4) Disconnect USB and connect Arduino external power.
5) Place Create on large, flat surface (ie. the floor)
6) Power up the Create.
7) Restart Arduino.
. 
The Create should cycle through a series of movements using the two methods of control as defined below. 
  • driveDirect
    • Drive straight
    • Spin CounterClockwise
    • Spin Clockwise
    • Stop
  • drive
    • Turn Left
    • Turn Right
    • Drive Straight
    • Spin Clockwise
    • Spin CounterClockwise
    • Stop


Reading Sensor Data

Sensor data can be read in two different ways. While both methods are described in the OIM, this example will only cover the getSensors() approach. The Create automatically updates its sensor data every 15ms. The user can choose often to read the values of those readings. While calling getSensors more frequently will cause no harm, the values read in that period will be redundant.
To read a sensor, the following information is needed
  • Sensor packet ID - the number associated with the sensor value the user is trying to read. Packets 0-6 are associated with groups of sensor values. Packet 6 is associated with all sensor values available 
  • Size of sensor packet (in bytes) - the number of bytes returned when the user calls a sensor packet ID 
  • Variable type returned - the way the bytes received must be interpreted. 
Example 1: Packet 7 returns one byte. However, it must be interpreted as individual bits. A value of 3 means that bytes 0 and 1 are 1s and therefore the Left and Right Bumpers are triggered.
Example 2: Packet 28 returns 2 bytes. They must be interpreted as one unsigned integer value. As in the "Drive Forward 20cm" example, a value of 1 and 44 would mean that the Left Cliff Sensor is reading 300.
All of this information can be found in the Open Interface Manual beginning on pg. 17. 
Useful Arduino functions for interpreting sensor values
  • bitRead - Reads an individual bit in a byte
  • Bitshift - Shifts the bits in a variable in either direction. Useful for high_byte, low_byte composition
  • BitShiftCombine - Function included in the example (defined at the bottom). Uses Bitshift to combine to bytes into a 16 bit int. Note that the int may be signed or unsigned depending on the receiving variable type. 

getSensors(uint8_t packetID, uint8_t* destination, uint8_t length)
  • packetID - number of packet to read
  • destination - an array with at at least "length" entries. Note that arrays are 0-indexed. ie, the first value in an array of 52 entries is array[0]. The last entry is array[51].
  • length - number of bytes associated with packetID being used.

Process for running sketch:
1) Open Full_Sensor_Test.ino - In the Arduino IDE: File > Examples > Roomba > TTU Examples > Full_Sensor_Test
2) Upload sketch to Arduino Mega
3) Open Arduino Serial Monitor - Set baud to 57600
4) Power ON Create
5) Restart the Arduino
Data from sensor packet 6 (all sensor data) should be displayed in the Serial Monitor. For more information regarding the nature of the sensor data, see the Open Interface Manual.


Basic Object Avoidance

This example demonstrates the use of the Create's sensors to navigate around obstacles. When executed, the Create should drive forward. When it bumps into an object, it should back up and turn away from the object. Sensor data is read using getSensors and motor control is implemented using driveDirect.


1) Turn Create to OFF.
2) Open Basic_Object_Avoidance.ino - In the Arduino IDE: File > Examples > Roomba > TTU Examples > Basic_Object_Avoidance
3) Upload sketch to the Arduino Mega.
WARNING: If the Create is on, the sketch will start as soon as the upload is complete. Before uploading, turn the Create off. It is a good practice to ensure that adequate space is available in case of accidental movement.
4) Disconnect USB and connect Arduino external power.
5) Place Create on large, flat surface (ie. the floor).
6) Power up the Create.
7) Restart Arduino. 

Friday, October 18, 2013

Simple Face Tracking with OpenCV, myrobotlab GUI, and Arduino

In this post I will detail how to easily use OpenCV with an Arduino to detect and track a face. There are many methods out there, but this method gives you the best OpenCV GUIs that I have seen. Vision processing is never simple, but I think you will be pleasantly surprised.

First things first, I would probably get a lot more Google hits if my title said install OpenCV on Arduino. Many wayward Arduino users have traveled that road only to feel a little foolish when they realize just how impossible that is. An Arduino doesn't come close to cutting it in terms of processing power. There is a project porting OpenCV to a rasberrypi, but that is a different post. What we will be doing is using a computer to process video from a connected camera and then send the useful data to an Arduino in the form of (x,y) coordinates via serial. This is cool because it means that your Arduino can be connected via Bluetooth or USB and can do other things while the computer handles the heavy lifting.

The program that I will be using is called myrobotlab (MRL). I go into more detail in my Intro to myrobotlab post, but basically it is opensource, free, and in active development. When I set out to find an easy, GUI enabled OpenCV platform, this is what I found. While I have not done a full out comparison to ROS or RoboRealm, my general impression is that ROS is quite a bit more complicated, and RoboRealm is quite a bit more expensive (MRL is free). Regardless, you want a simple OpenCV, Arduino system. Let's go get one.

First you need to install myrobotlab. See the Quick Start section for instructions. Make sure you get the right version of Java. I seem to remember having some problems with that. If you do, post a comment or ask GroG on the site. I'd also recommend that you go ahead and create an account on myrobotlab.org. If you need help or have a question, that's where you need to be.

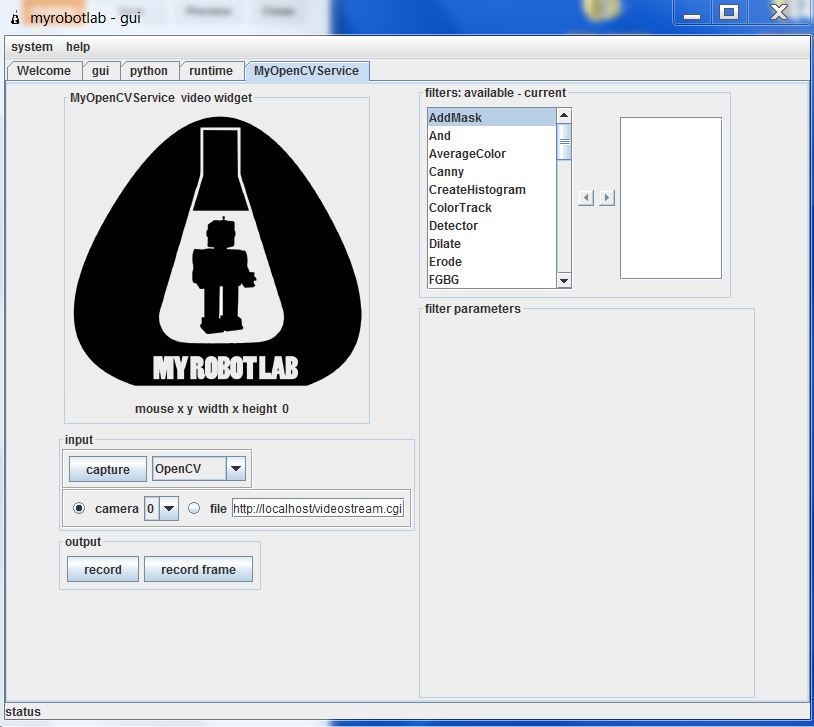
Next open MRL by clicking on the batch file and go to the runtime tab. Here you'll find a list of all the services MRL currently has to offer. Go ahead and scroll down to OpenCV. Right click on it to download and install it.

Then right click on it again and click start. It will want you to give it a name. Call it whatever you want. You do this so you can have multiple instances of the same service open if you want to.

Now you are come to the OpenCV GUI. It will default to camera 0. If you have multiple cameras connected, this might not be the one you want. Click capture to see what camera you have selected, and find the one you want.

Now we need to add our filters. First you need to scroll through and select PyramidDown. Either right click and add or select and hit the right arrow. Give it whatever name you want. PyramidDown makes the video smaller (you'll see). FaceDetect is pretty processor heavy, and unless you have a monster work station you'll want to use it. It will actually increase performance.

Next add the FaceDetect filter. Now click capture and go to town. You should see video in the box and a box drawn around any face. This is a good time to play around. The majority of the filters can be accessed through the GUI. See what filters help you isolate the face(or whatever you are trying to track). Try multiple PyramidDown filters or an InRange filter. Also note that if you right click in the display window, it will give you the coordinates in pixels. This is useful behavior.

Now I hit you with the bait and switch. It's not nice and GUI all the way to the end. Reason being, you need another service (the serial service) to actually get the data from your nice OpenCV box to your Arduino board. This requires you to use the python service.

The code really isn't that bad. I knew no python when I started working with myrobotlab. I still know very little, but I have pieced stuff together well enough from example sketches. You can look at the sketch below, but I would recommend you download it HERE.


# This code creates an opencv service and tracks a face.# It thens finds the center of the face and converts the position to a scale of 1-100# This information is then sent via serial service to any receiving device
# If the script needs to be restarted, completely close MRL and reopen it.# 8/27/13
import time
from java.lang import Stringfrom java.lang import Classfrom java.awt import Rectanglefrom org.myrobotlab.service import Runtimefrom org.myrobotlab.service import OpenCVfrom org.myrobotlab.opencv import OpenCVDatafrom com.googlecode.javacv.cpp.opencv_core import CvPoint;from org.myrobotlab.service import OpenCV
# create or get a handle to an OpenCV serviceopencv = Runtime.createAndStart("opencv","OpenCV")
# Convert the video to Black and Whiteopencv.addFilter("Gray1", "Gray")                             # Sometimes gray seems to help# reduce the size - face tracking doesn't need much detail. The smaller the fasteropencv.addFilter("PyramidDown1", "PyramidDown")# add the face detect filteropencv.addFilter("FaceDetect1", "FaceDetect")

#create a Serial service named serialserial = Runtime.createAndStart("serial","Serial")
# This function is called every time the OpenCV service has data available.# This will depend on the framerate of the video, but will probably be# somewhere around 15 times a second.def input():    global x    global y    global sposx    global sposy    global posx    global posy
    # Get OpenCV data    opencvData = msg_opencv_publishOpenCVData.data[0]
    if (opencvData.getBoundingBoxArray().size() > 0) :    # If the box surrounding a face exists     rect = opencvData.getBoundingBoxArray().get(0)       # Store the information in rect     posx = rect.x                                        # Get the x position of the corner     posy = rect.y                                        # Get the y position of the corner
     w = rect.width                                       # Get the width     h = rect.height                                      # Get the height     sposx = (w/2)     sposy = (h/2)     # Get the x and y of the center in pixels. Origin is in top left corner     x = (posx + sposx)
     y = (posy + sposy) 
     # Convert x,y pixels to (x,y) coordinates from top left.     # Note that 320 and 4240 will need to be changed if another pyramid down is used     # It may also need to be changed depending on your cameras specifications.     # This gets the position in a scale from 1, 100     x = int(translate(x, 1, 320, 1, 100));                  # translate() works the same way the Arduino map() function would     y = int(translate(y, 1, 240, 1, 100));     print 'x: ' ,  x                                        # print x to the python readout     print 'y: ' ,  y                                        # print y to the python readout     #write a series of bytes to the serial port     serial.write(250) # pan code     serial.write(x)   # x coordinate     serial.write(251) # tilt code     serial.write(y)   # y coordinate
 
#connect to a serial port COM15 57600 bitrate 8 data bits 1 stop bit 0 parity#This is what you want for an Arduino. Change the COM port to the one you are using.serial.connect("COM15", 57600, 8, 1, 0)#sometimes its important to wait a little for hardware to get readysleep(1)          # Note that this is 1 full second.
# create a message route from opencv to python so we can see the coordinate locationsopencv.addListener("publishOpenCVData", python.name, "input");
# Start capturing videoopencv.capture()  # Add a 1 inside the parenthesis to use camera 1


# Create function to scale values. Mimics Arduino map() function.def translate(value, leftMin, leftMax, rightMin, rightMax):    # Figure out how 'wide' each range is    leftSpan = leftMax - leftMin    rightSpan = rightMax - rightMin
    # Convert the left range into a 0-1 range (float)    valueScaled = float(value - leftMin) / float(leftSpan)
    # Convert the 0-1 range into a value in the right range.    return rightMin + (valueScaled * rightSpan)


Copy that into the python window and you're almost done. Towards the end you need to change the COM port to the one you are using. Below that, you will see opencv.capture(). If you are using a camera other than camera 0, put that number in the parenthesis.

Now connect your Arduino and click execute. You will see several readouts in the java window. The last one you should see should say
[opencv_videoProcessor] INFO  org.myrobotlab.opencv.VideoProcessor  - using com.googlecode.javacv.OpenCVFrameGrabber
That means you made it to the bottom of the script and you are getting video.

This is what is happening. The OpenCV service applies 3 filters: Gray, PyramidDown, and FaceDetect. It gets a box around the face and passes the coordinates in pixels to the python service. The python service finds the center of the box and the converts the pixel coordinates to a scale of 1-100 with the origin in the top left with positive down and to the right. The python service then passes the coordinates to the Serial service which connects to your COM port and begins sending x, y values across. It sends an identifier, then the value in the order below. Both the identifier and the coordinate are 1 byte in length.
  • 250
  • x coordinate
  • 251
  • y coordinate
What you do with those values on the Arduino side is up to you. That is why I used the serial service. It enables you to plug this system up to an existing Arduino project or any existing Arduino sketch and get vision processing data with nothing more that a Serial.read() and some if statements. Best of all, it is all in Arduino C, so anyone that has learned to program on an Arduino (like myself) can deal with the complicated stuff in a language they already know using the libraries that they already know.

I chose to make a pan-tilt camera mount that follows people, but like I said above, what you do with those (x,y) coordinates is really up to you. If you need help with serial communication, see my posts HERE and HERE. If you just want my pan-tilt Arduino code get it HERE. If you want the detailed description... wait until I write that post.

That's all I have. I plan on doing more specific examples in the future. For now, this should get you started. For more examples look at my labels. The one's labeled myrobotlab or vision processing will be the ones to check out. 

I hope this is of use to someone. I really do think myrobotlab is one of the best free, simple GUI system for OpenCV out there. It is fairly easy to use, and the support is great (just post on the site and ask for help). When I began using it, there was no serial service. I asked for one, and within a week GroG had added one.Who could ask for more?

Goodluck! May your frame rates always be high and your visions always be processed.
-Matthew